Thoughts From David,
If you like charts & graphs this will be a great Monday with Matthew. Yes, Matthew in addition to I believes all economists, was off on what interest rates might do this year. This is a quick recap and explanation of why the rates did what they did and what we can expect in the short term. Great insights on mortgage rates Vs inflation. Yes, the market continues to shift, still no bubble, and still some great opportunities out there for both buyers and sellers. I am happy to chat if you have any questions about how things impact your specific situation.
The Landscape for Mortgage Rates and Inflation in 2022
by Matthew Gardner
Hello there, I’m Windermere’s Chief Economist Matthew Gardner and welcome to this month’s episode of Monday with Matthew. You know, one of the many things I love about being an economist is that it is a remarkably humbling profession. You see, just when we start to believe that our models are close to perfection, something comes along to remind us that forecasting isn’t an exact science.
And if you’re wondering what I am talking about, I recently took a look at the 2022 mortgage rate forecast I put out at the start of the year and…well, let’s say that rates rose at a far faster pace than I had anticipated. I thought that now would be a good time to take another look at rates and share my thoughts on the direction that they will likely take during the rest of the year and my reasoning behind it. And that means we need to talk about inflation.
30-Year Conventional Mortgage Rates: 2018 – 2022

So, a quick look back. As you can see, there wasn’t much to celebrate in 2018, with rates rising from 3.95% to 4.94% before pulling back and ending the year at around 4.5%. In 2019, rates fell following the Feds’ announcement that they were likely done with raising the Fed Funds Rate, and the mortgage market also reacted positively to the announcement from the White House that they were going to impose tariffs on select Chinese imported goods. We saw an uptick in late summer, but that was mainly due to news related to BREXIT.
In 2020, rates were dropping but spiked very briefly when COVID-19 shut the country down and bond markets panicked. But with the Fed jumping in with an emergency rate cut and announcing that they would start buying a significant number of treasuries and mortgage-backed securities, rates tumbled to an all-time low of just 2.66%. In 2021, rates rose as new COVID infections plummeted, but then dropped again as the Delta variant took hold, but ultimately trended modestly higher in the second half of the year.
And then we get to 2022. Rates started the year at just over 3.1% but have since skyrocketed to over 5.8% before a small pullback that started a few weeks ago. In as much as economists expected rates to rise this year, nobody anticipated how fast they would rise. So, what went wrong? Well, there’s actually a rather simple answer.
As usual, a little perspective. Between 1990 and the pre-bubble peak in 2006, home prices rose by 142%, which was a pretty impressive annual increase of 5.6% over a 16 1/2-year period. When the market crashed, prices dropped by 33%, but from the 2012 low to today, prices have risen by 131%, or at an even faster annual rate of 8.6% over a shorter period of time—10 years.
You may think that prices rising at an annual rate that exceeds the pace seen before the market crash is what has some brokers and home buyers concerned, but that really isn’t what has many people scared. It’s this.
Even though we expected rates to trend higher in 2022, there were two things we hadn’t built into our forecast models.
- Russia’s invasion of Ukraine
- Inflation continued to climb for far longer than we expected
So, how do things look for the rest of the year? To explain my thinking, it’s important to remember that the bond market and, by implication, mortgage rates hate nothing more than high inflation because when inflation is running hot, it limits demand for bonds which, in turn, forces the interest rate payable on bonds to rise and this pushes mortgage rates higher.
But what’s been fascinating to watch is that over the past couple of weeks, rates have actually been dropping, which is certainly counterintuitive given where inflation is today. And the only reason I can see for this is that bond traders were thinking that inflation might be topping out.
But then we got the June CPI numbers, and it certainly didn’t suggest that inflation was slowing, in fact it showed the opposite. But even though the total inflation rate hasn’t yet peaked, I believe that a shift has actually started and that we are closer to a peak in inflation than you may think.
Indicators of Inflation: Consumer Spending
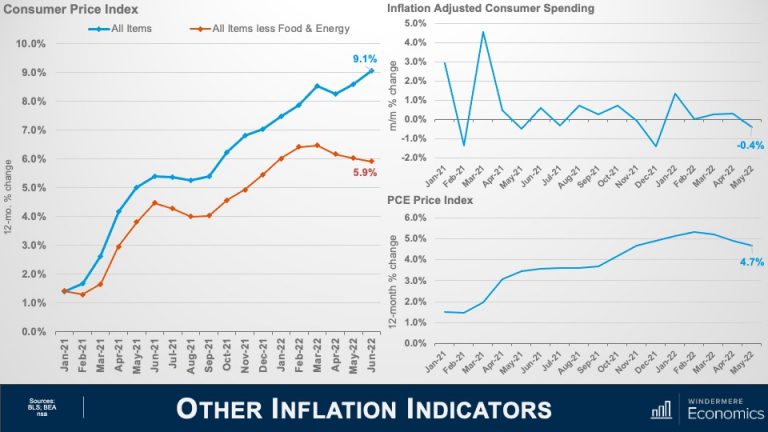
The June CPI report showed the headline inflation rate still trending higher but look at the core rate which excludes the volatile food & energy sectors. That has actually been pulling back for the past three months. And consumer spending when adjusted for inflation fell 0.4% in May. That’s the first monthly drop since last December, and I expect the June number when it comes out at the end of the month to show spending dropping even further.
This is a very important dataset that often gets overlooked but it is starting to tell me that the economy is slowing because of inflation and slower spending acts as a headwind to further price increases.
The core PCE price index is up 4.7% year-over-year, but this was the smallest annual increase since last November and you can see that it is also starting to roll over. This index is actually the Fed’s favored measure of inflation as it’s more comprehensive that the CPI number as it measures the change in spending for all consumers, not just urban households.
Indicators of Inflation: 5-Year Breakevens and Producer Price Index
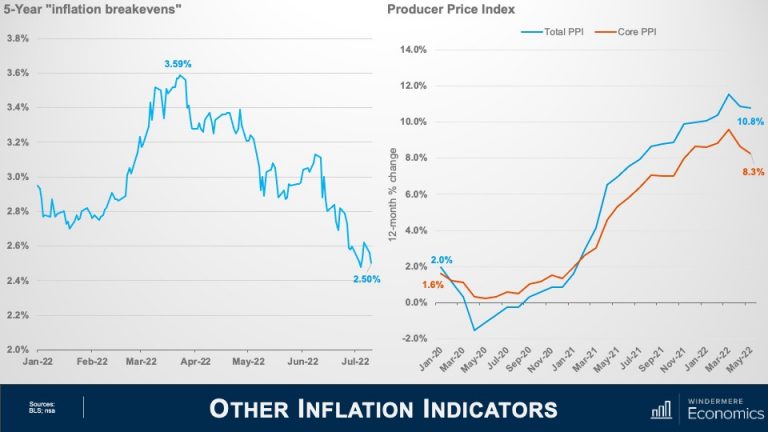
The five-year “inflation breakeven” has plunged more than a full percentage point since peaking at just under 3.6% in late March. And this number is important as it lets us know where bond traders expect the average inflation rate to be over the next five years.
The Producer Price Index measures inflation at the wholesale, not retail, level and even though the total rate rose as energy costs continue to impact the manufacturing sector, the core rate has been pulling back for the past three months. Now let’s look at some commodity prices and see what’s going on there.
Selected Commodity Prices: Natural Gas, Copper, Soybeans, Wheat
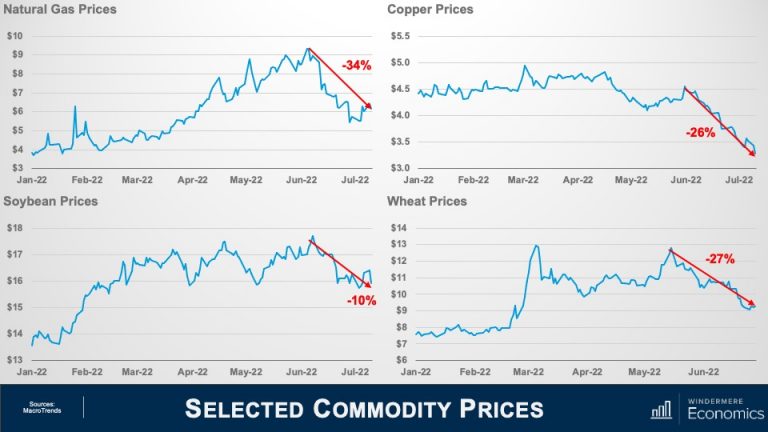
- The price for natural gas is down over 34% from its recent high
- Copper prices are down 26% from the recent June peak and down substantially from March
- Soybean prices are down 10%
- Despite the war in Ukraine, wheat prices are down 27% from June
Retail Gas Prices: West Coast, West Coast Excluding CA, U.S.
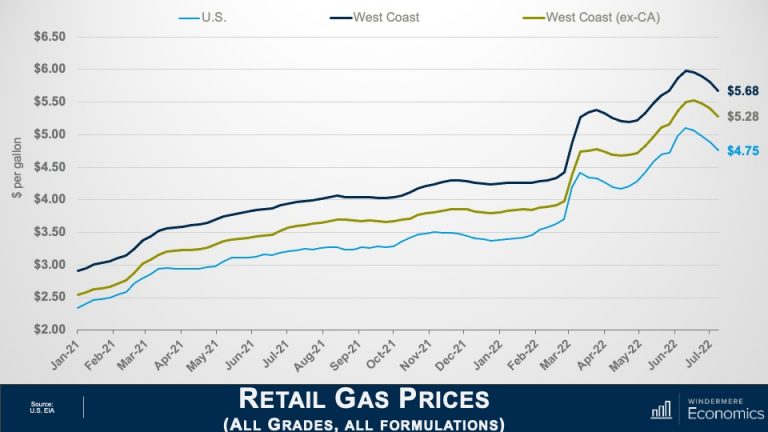
It appears as if gas prices have also rolled over. Of course, here on the West Coast it’s more expensive than the nation even when you take California out of the equation.
U.S. Treasury Yields: 10-Year and 2-Year Constant
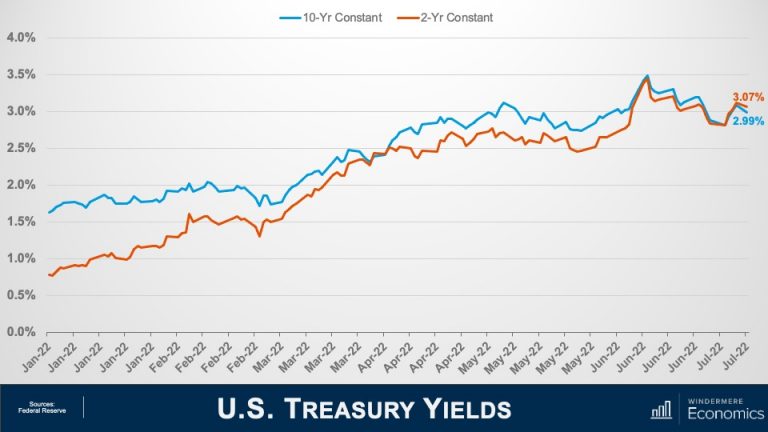
And finally, to cap things off, traders must also be pondering the same numbers as I am because bond yields themselves have been tumbling at both the long and short ends of the yield curve with the 10-year note still yielding less than 3% even after the CPI report and two-year yields, while still elevated, are still down from 2.42% just two weeks ago.
So, given all the charts we have looked at, I hope that you too are seeing some light at the end of the tunnel when it comes to the likelihood that inflation is about to start easing.
No doubt, the headline inflation number for June wasn’t one that anyone wanted to see but, if the trends we have looked at continue, I still expect inflation to start slowly creeping lower, which will push bond prices higher, yields will start to pause—if not drop—and that will allow mortgage rates to hold at or close to their current levels for the time being. Although we could see rates coming down, though they will still start with a five for the foreseeable future. I hope that you have found my thoughts of interest.
As always, if you have any questions or comments about this particular topic, please do reach out to me but, in the meantime, stay safe out there. I look forward to visiting with you all again next month.
Bye now.
A Busy Legislative Session for Housing
Will Rising Foreclosures Impact the Housing Market?
Key Factors to Note as the Market Recalibrates in the New Year
Questions about the market or this post specifically?
I am proud and excited to be a real estate agent and E-Pro in the Puget Sound area! Being an E-Pro means, I am up to date on how best to use technology to benefit my clients. That, along with the high level of service and ethics expected as a Realtor, means a lot to me and my ability to help all my clients.
Navigating staying knowledgeable about the curves, hills, and some of the unavoidable potholes of the real estate market are what I love and do best, so feel free to contact me for any inquiries you may have.

Thoughts From David,
If you like charts & graphs this will be a great Monday with Matthew. Yes, Matthew in addition to I believes all economists, was off on what interest rates might do this year. This is a quick recap and explanation of why the rates did what they did and what we can expect in the short term. Great insights on mortgage rates Vs inflation. Yes, the market continues to shift, still no bubble, and still some great opportunities out there for both buyers and sellers. I am happy to chat if you have any questions about how things impact your specific situation.
The Landscape for Mortgage Rates and Inflation in 2022
by Matthew Gardner
Hello there, I’m Windermere’s Chief Economist Matthew Gardner and welcome to this month’s episode of Monday with Matthew. You know, one of the many things I love about being an economist is that it is a remarkably humbling profession. You see, just when we start to believe that our models are close to perfection, something comes along to remind us that forecasting isn’t an exact science.
And if you’re wondering what I am talking about, I recently took a look at the 2022 mortgage rate forecast I put out at the start of the year and…well, let’s say that rates rose at a far faster pace than I had anticipated. I thought that now would be a good time to take another look at rates and share my thoughts on the direction that they will likely take during the rest of the year and my reasoning behind it. And that means we need to talk about inflation.
30-Year Conventional Mortgage Rates: 2018 – 2022

So, a quick look back. As you can see, there wasn’t much to celebrate in 2018, with rates rising from 3.95% to 4.94% before pulling back and ending the year at around 4.5%. In 2019, rates fell following the Feds’ announcement that they were likely done with raising the Fed Funds Rate, and the mortgage market also reacted positively to the announcement from the White House that they were going to impose tariffs on select Chinese imported goods. We saw an uptick in late summer, but that was mainly due to news related to BREXIT.
In 2020, rates were dropping but spiked very briefly when COVID-19 shut the country down and bond markets panicked. But with the Fed jumping in with an emergency rate cut and announcing that they would start buying a significant number of treasuries and mortgage-backed securities, rates tumbled to an all-time low of just 2.66%. In 2021, rates rose as new COVID infections plummeted, but then dropped again as the Delta variant took hold, but ultimately trended modestly higher in the second half of the year.
And then we get to 2022. Rates started the year at just over 3.1% but have since skyrocketed to over 5.8% before a small pullback that started a few weeks ago. In as much as economists expected rates to rise this year, nobody anticipated how fast they would rise. So, what went wrong? Well, there’s actually a rather simple answer.
As usual, a little perspective. Between 1990 and the pre-bubble peak in 2006, home prices rose by 142%, which was a pretty impressive annual increase of 5.6% over a 16 1/2-year period. When the market crashed, prices dropped by 33%, but from the 2012 low to today, prices have risen by 131%, or at an even faster annual rate of 8.6% over a shorter period of time—10 years.
You may think that prices rising at an annual rate that exceeds the pace seen before the market crash is what has some brokers and home buyers concerned, but that really isn’t what has many people scared. It’s this.
Even though we expected rates to trend higher in 2022, there were two things we hadn’t built into our forecast models.
- Russia’s invasion of Ukraine
- Inflation continued to climb for far longer than we expected
So, how do things look for the rest of the year? To explain my thinking, it’s important to remember that the bond market and, by implication, mortgage rates hate nothing more than high inflation because when inflation is running hot, it limits demand for bonds which, in turn, forces the interest rate payable on bonds to rise and this pushes mortgage rates higher.
But what’s been fascinating to watch is that over the past couple of weeks, rates have actually been dropping, which is certainly counterintuitive given where inflation is today. And the only reason I can see for this is that bond traders were thinking that inflation might be topping out.
But then we got the June CPI numbers, and it certainly didn’t suggest that inflation was slowing, in fact it showed the opposite. But even though the total inflation rate hasn’t yet peaked, I believe that a shift has actually started and that we are closer to a peak in inflation than you may think.
Indicators of Inflation: Consumer Spending

The June CPI report showed the headline inflation rate still trending higher but look at the core rate which excludes the volatile food & energy sectors. That has actually been pulling back for the past three months. And consumer spending when adjusted for inflation fell 0.4% in May. That’s the first monthly drop since last December, and I expect the June number when it comes out at the end of the month to show spending dropping even further.
This is a very important dataset that often gets overlooked but it is starting to tell me that the economy is slowing because of inflation and slower spending acts as a headwind to further price increases.
The core PCE price index is up 4.7% year-over-year, but this was the smallest annual increase since last November and you can see that it is also starting to roll over. This index is actually the Fed’s favored measure of inflation as it’s more comprehensive that the CPI number as it measures the change in spending for all consumers, not just urban households.
Indicators of Inflation: 5-Year Breakevens and Producer Price Index

The five-year “inflation breakeven” has plunged more than a full percentage point since peaking at just under 3.6% in late March. And this number is important as it lets us know where bond traders expect the average inflation rate to be over the next five years.
The Producer Price Index measures inflation at the wholesale, not retail, level and even though the total rate rose as energy costs continue to impact the manufacturing sector, the core rate has been pulling back for the past three months. Now let’s look at some commodity prices and see what’s going on there.
Selected Commodity Prices: Natural Gas, Copper, Soybeans, Wheat

- The price for natural gas is down over 34% from its recent high
- Copper prices are down 26% from the recent June peak and down substantially from March
- Soybean prices are down 10%
- Despite the war in Ukraine, wheat prices are down 27% from June
Retail Gas Prices: West Coast, West Coast Excluding CA, U.S.

It appears as if gas prices have also rolled over. Of course, here on the West Coast it’s more expensive than the nation even when you take California out of the equation.
U.S. Treasury Yields: 10-Year and 2-Year Constant

And finally, to cap things off, traders must also be pondering the same numbers as I am because bond yields themselves have been tumbling at both the long and short ends of the yield curve with the 10-year note still yielding less than 3% even after the CPI report and two-year yields, while still elevated, are still down from 2.42% just two weeks ago.
So, given all the charts we have looked at, I hope that you too are seeing some light at the end of the tunnel when it comes to the likelihood that inflation is about to start easing.
No doubt, the headline inflation number for June wasn’t one that anyone wanted to see but, if the trends we have looked at continue, I still expect inflation to start slowly creeping lower, which will push bond prices higher, yields will start to pause—if not drop—and that will allow mortgage rates to hold at or close to their current levels for the time being. Although we could see rates coming down, though they will still start with a five for the foreseeable future. I hope that you have found my thoughts of interest.
As always, if you have any questions or comments about this particular topic, please do reach out to me but, in the meantime, stay safe out there. I look forward to visiting with you all again next month.
Bye now.
Questions about the market or this post specifically?
I am proud and excited to be a real estate agent and E-Pro in the Puget Sound area! Being an E-Pro means, I am up to date on how best to use technology to benefit my clients. That, along with the high level of service and ethics expected as a Realtor, means a lot to me and my ability to help all my clients.
Navigating staying knowledgeable about the curves, hills, and some of the unavoidable potholes of the real estate market are what I love and do best, so feel free to contact me for any inquiries you may have.


